Plot method for chent objects
# S3 method for chent
plot(x, ...)
Arguments
| x | The chent object to be plotted |
|---|---|
| ... | Further arguments passed to |
Examples
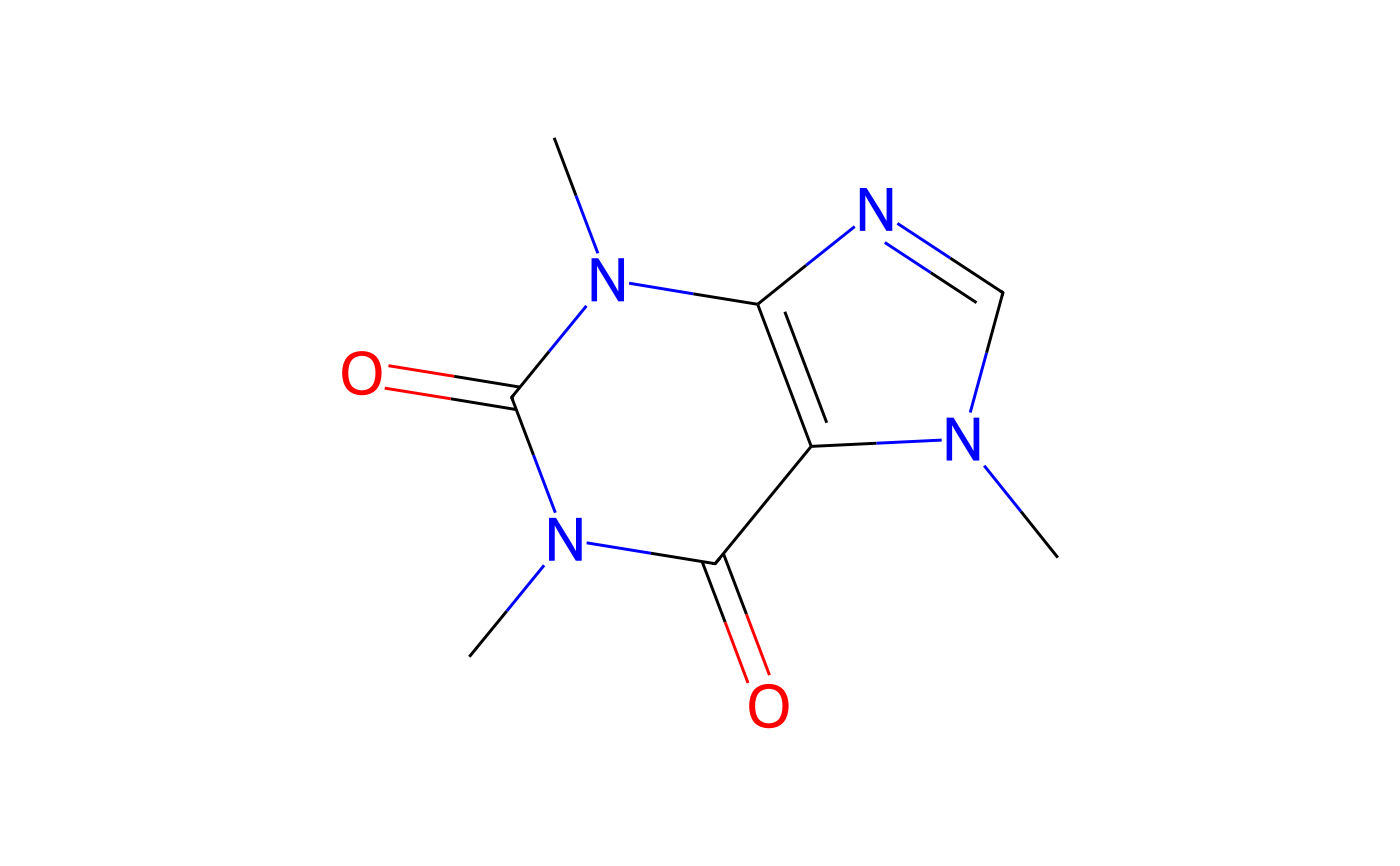
#>#> #>#>#> <chent> #> Identifier $identifier caffeine #> InChI Key $inchikey RYYVLZVUVIJVGH-UHFFFAOYSA-N #> SMILES string $smiles: #> PubChem_Canonical #> "CN1C=NC2=C1C(=O)N(C(=O)N2C)C" #> Molecular weight $mw: 194.2 #> PubChem synonyms (up to 10): #> [1] "caffeine" "58-08-2" #> [3] "1,3,7-Trimethylxanthine" "Guaranine" #> [5] "Thein" "Methyltheobromine" #> [7] "Cafeina" "Theine" #> [9] "Koffein" "Mateina"