Fit one or more kinetic models with one or more state variables to one or more datasets
mmkin.RdThis function calls mkinfit on all combinations of models and
datasets specified in its first two arguments.
mmkin(
  models = c("SFO", "FOMC", "DFOP"),
  datasets,
  cores = round(detectCores()/2),
  cluster = NULL,
  ...
)
Arguments
| models | Either a character vector of shorthand names like
|
|---|---|
| datasets | An optionally named list of datasets suitable as observed
data for |
| cores | The number of cores to be used for multicore processing. This
is only used when the |
| cluster | A cluster as returned by |
| ... | Further arguments that will be passed to |
Value
A two-dimensional array of mkinfit
objects that can be indexed using the model names for the first index (row index)
and the dataset names for the second index (column index).
See also
[.mmkin for subsetting, plot.mmkin for
plotting.
Examples
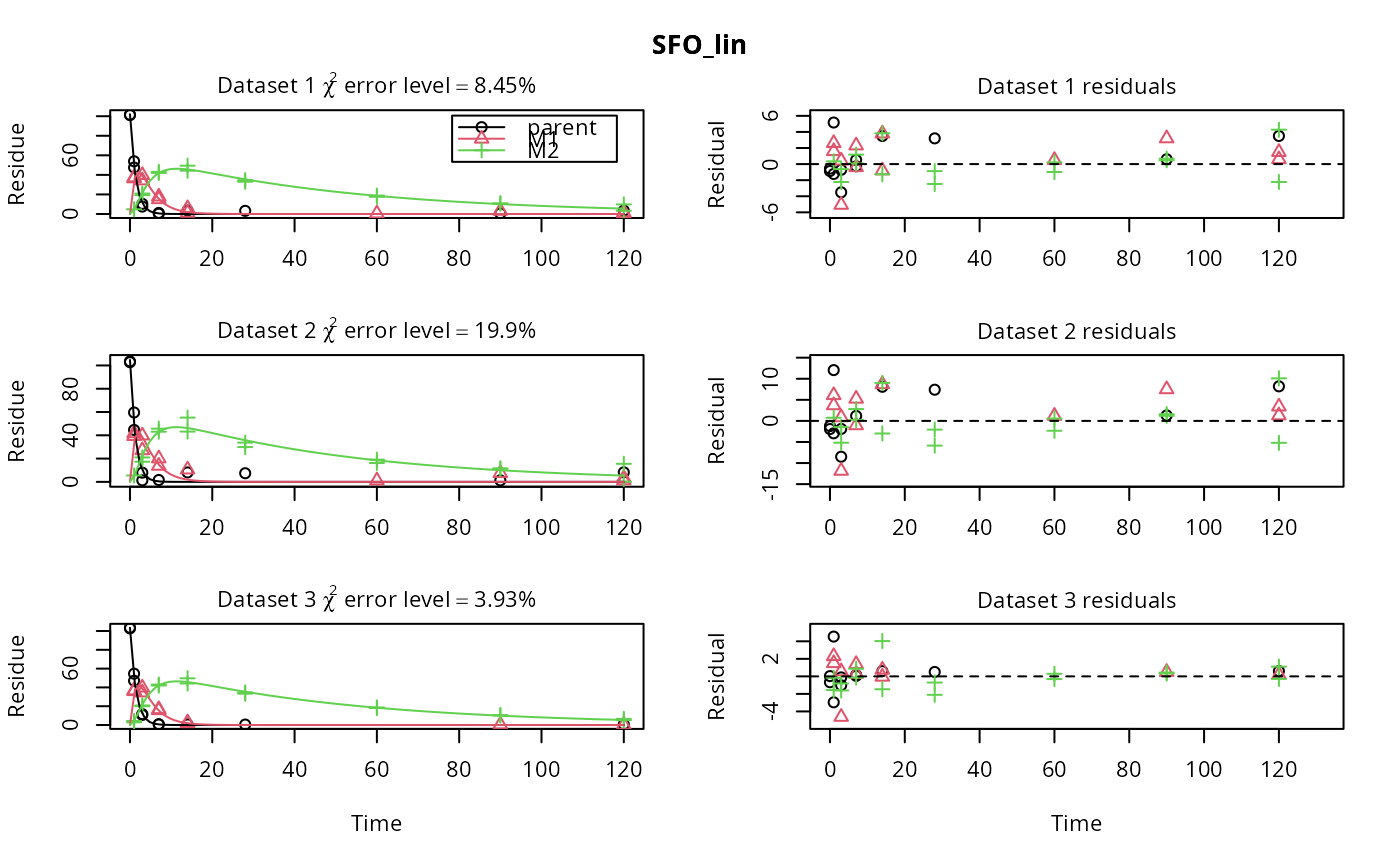
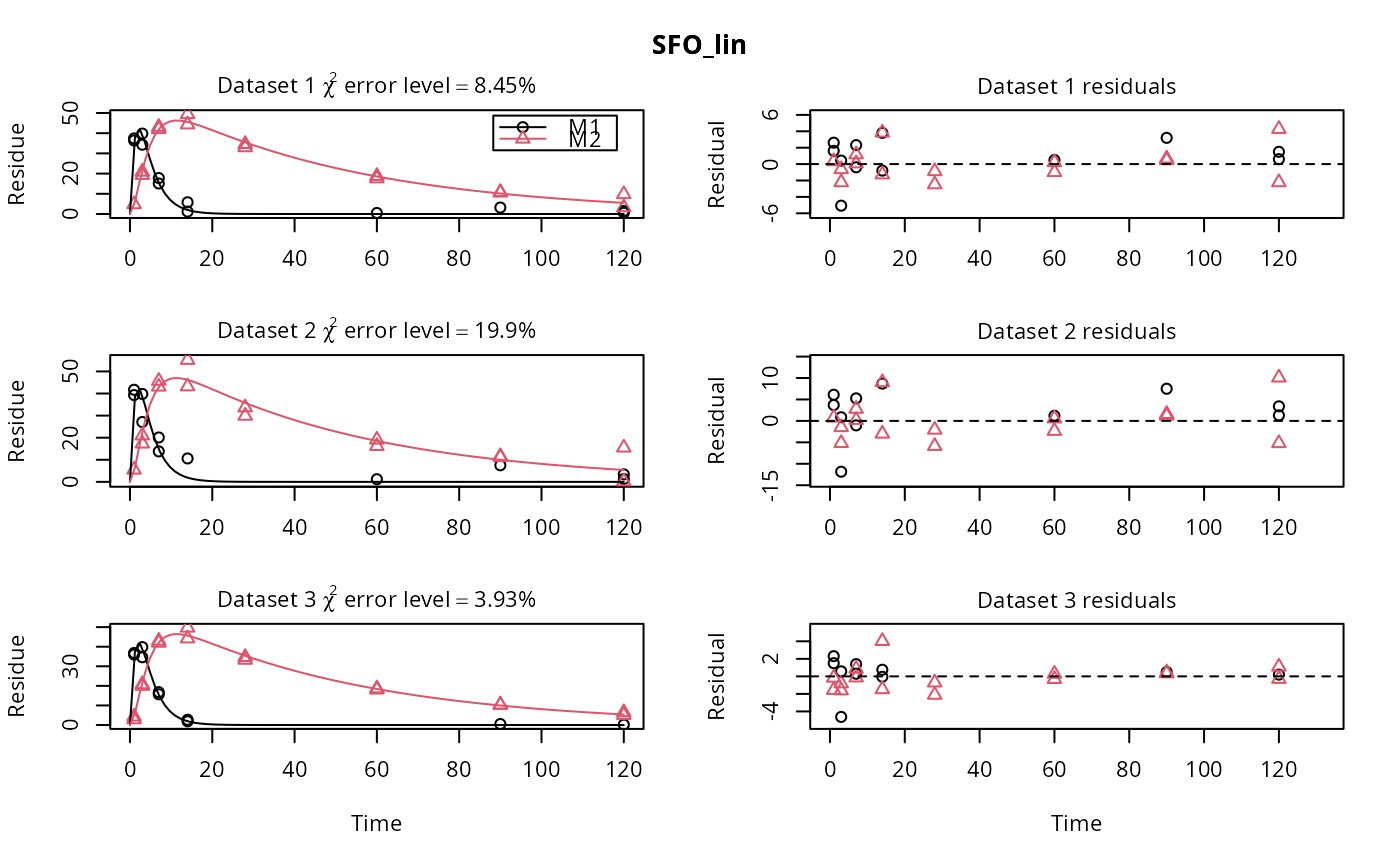
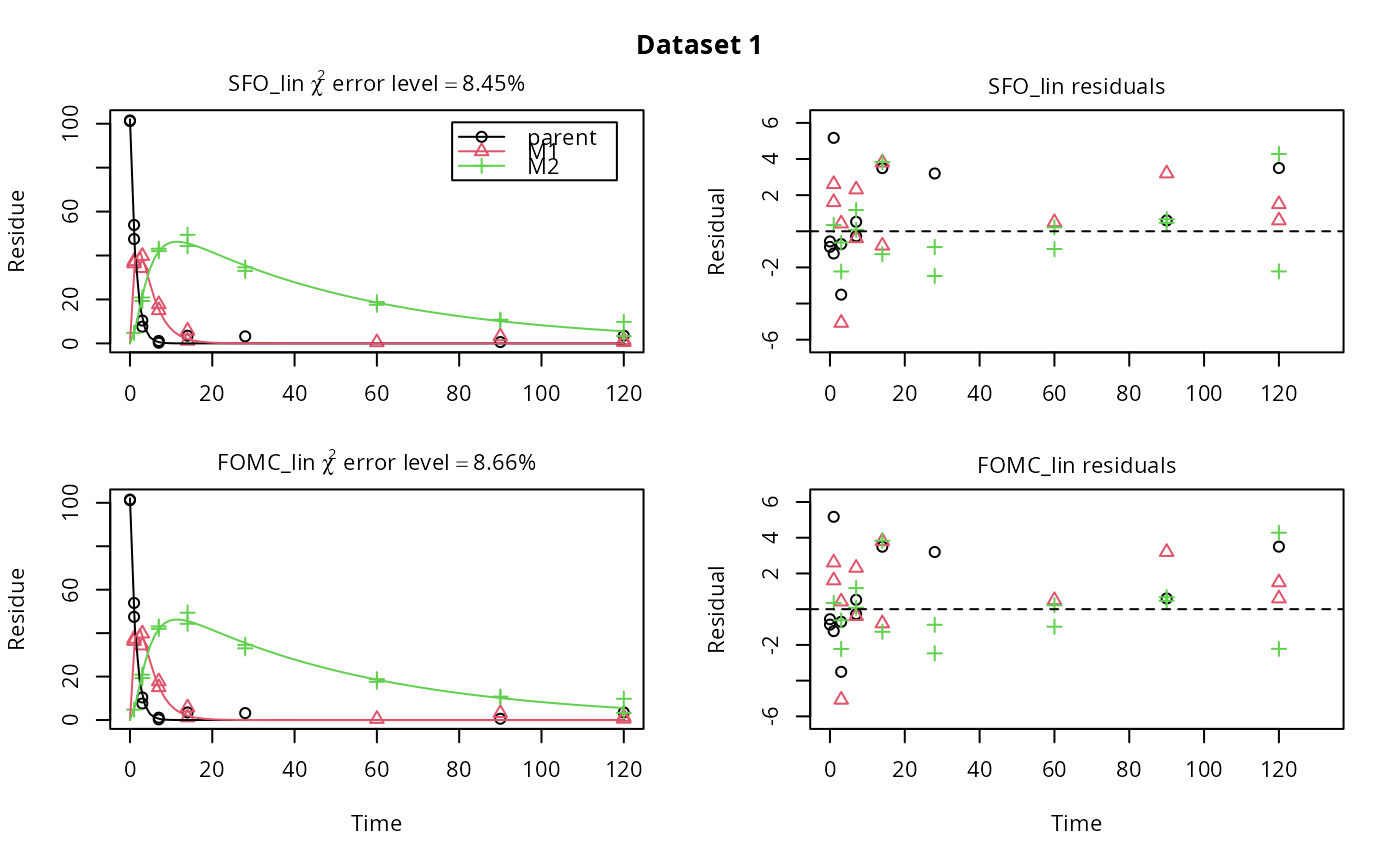
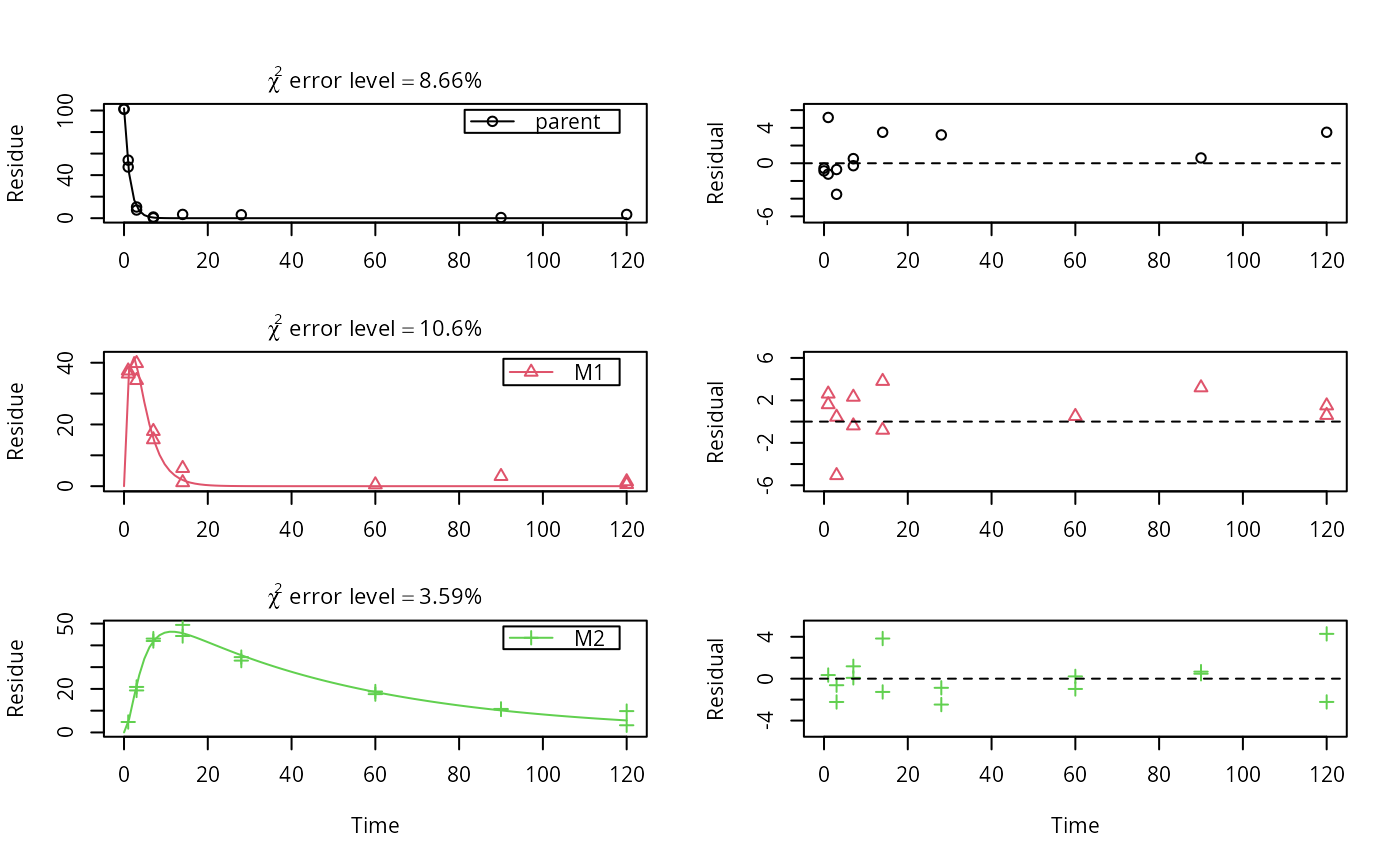
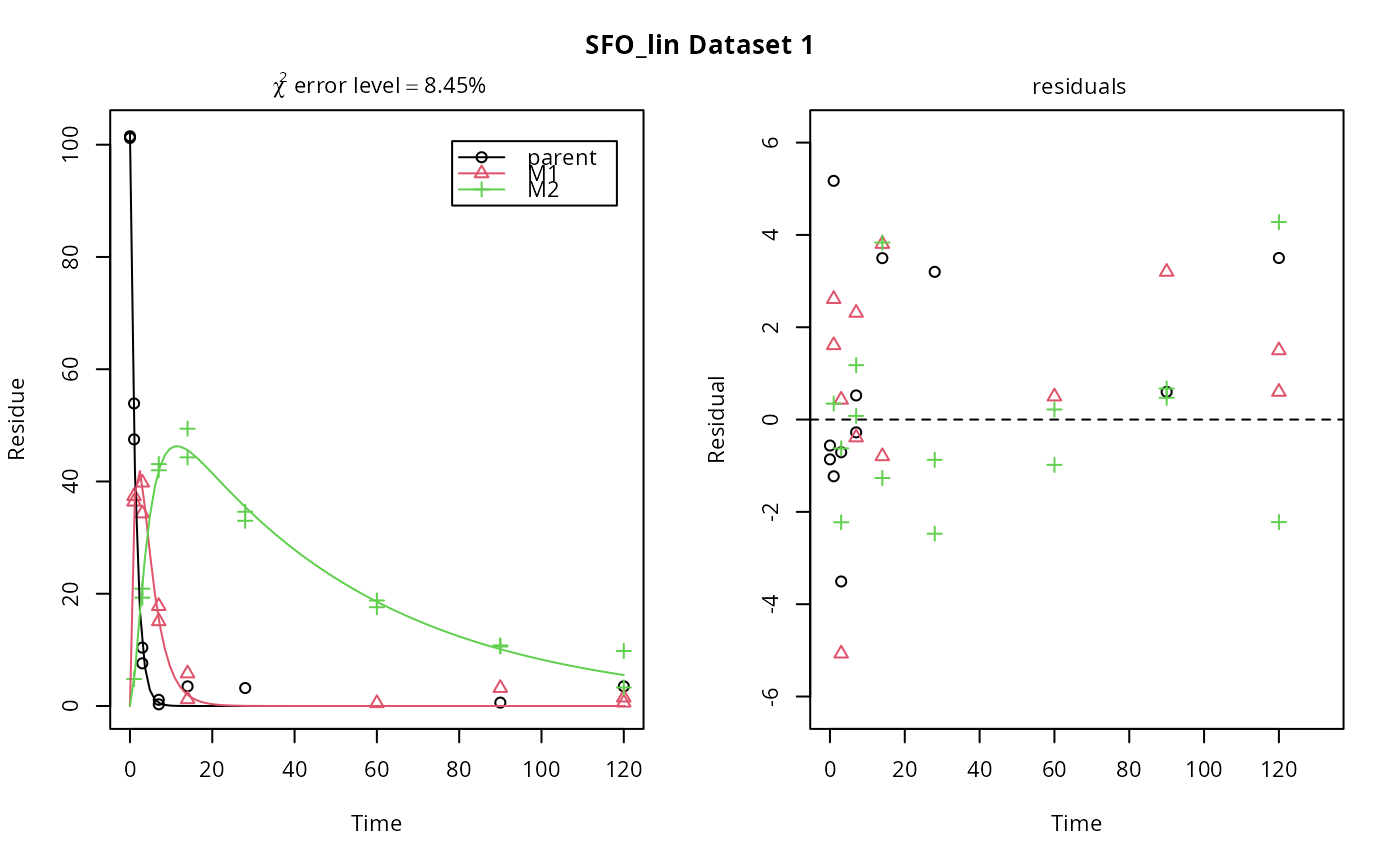
# \dontrun{ m_synth_SFO_lin <- mkinmod(parent = mkinsub("SFO", "M1"), M1 = mkinsub("SFO", "M2"), M2 = mkinsub("SFO"), use_of_ff = "max")#>m_synth_FOMC_lin <- mkinmod(parent = mkinsub("FOMC", "M1"), M1 = mkinsub("SFO", "M2"), M2 = mkinsub("SFO"), use_of_ff = "max")#>models <- list(SFO_lin = m_synth_SFO_lin, FOMC_lin = m_synth_FOMC_lin) datasets <- lapply(synthetic_data_for_UBA_2014[1:3], function(x) x$data) names(datasets) <- paste("Dataset", 1:3) time_default <- system.time(fits.0 <- mmkin(models, datasets, quiet = TRUE)) time_1 <- system.time(fits.4 <- mmkin(models, datasets, cores = 1, quiet = TRUE)) time_default#> User System verstrichen #> 16.471 0.352 5.654time_1#> User System verstrichen #> 19.578 0.000 19.590#> $ff #> parent_M1 parent_sink M1_M2 M1_sink #> 0.7340480 0.2659520 0.7505686 0.2494314 #> #> $distimes #> DT50 DT90 #> parent 0.8777689 2.915885 #> M1 2.3257452 7.725958 #> M2 33.7200890 112.015711 #># Use double brackets to extract a single mkinfit object, which will be plotted # by plot.mkinfit and can be plotted using plot_sep plot(fits.0[[1, 1]], sep_obs = TRUE, show_residuals = TRUE, show_errmin = TRUE)plot_sep(fits.0[[1, 1]]) # Plotting with mmkin (single brackets, extracting an mmkin object) does not # allow to plot the observed variables separately plot(fits.0[1, 1])# }
