Fit one or more kinetic models with one or more state variables to one or more datasets
Source:R/mmkin.R
mmkin.RdThis function calls mkinfit on all combinations of models and
datasets specified in its first two arguments.
mmkin(
  models = c("SFO", "FOMC", "DFOP"),
  datasets,
  cores = parallel::detectCores(),
  cluster = NULL,
  ...
)

# S3 method for mmkin
print(x, ...)
Arguments
| models | Either a character vector of shorthand names like
|
|---|---|
| datasets | An optionally named list of datasets suitable as observed
data for |
| cores | The number of cores to be used for multicore processing. This
is only used when the |
| cluster | A cluster as returned by |
| ... | Not used. |
| x | An mmkin object. |
Value
A two-dimensional array of mkinfit
objects and/or try-errors that can be indexed using the model names for the
first index (row index) and the dataset names for the second index (column
index).
See also
[.mmkin for subsetting, plot.mmkin for
plotting.
Author
Johannes Ranke
Examples
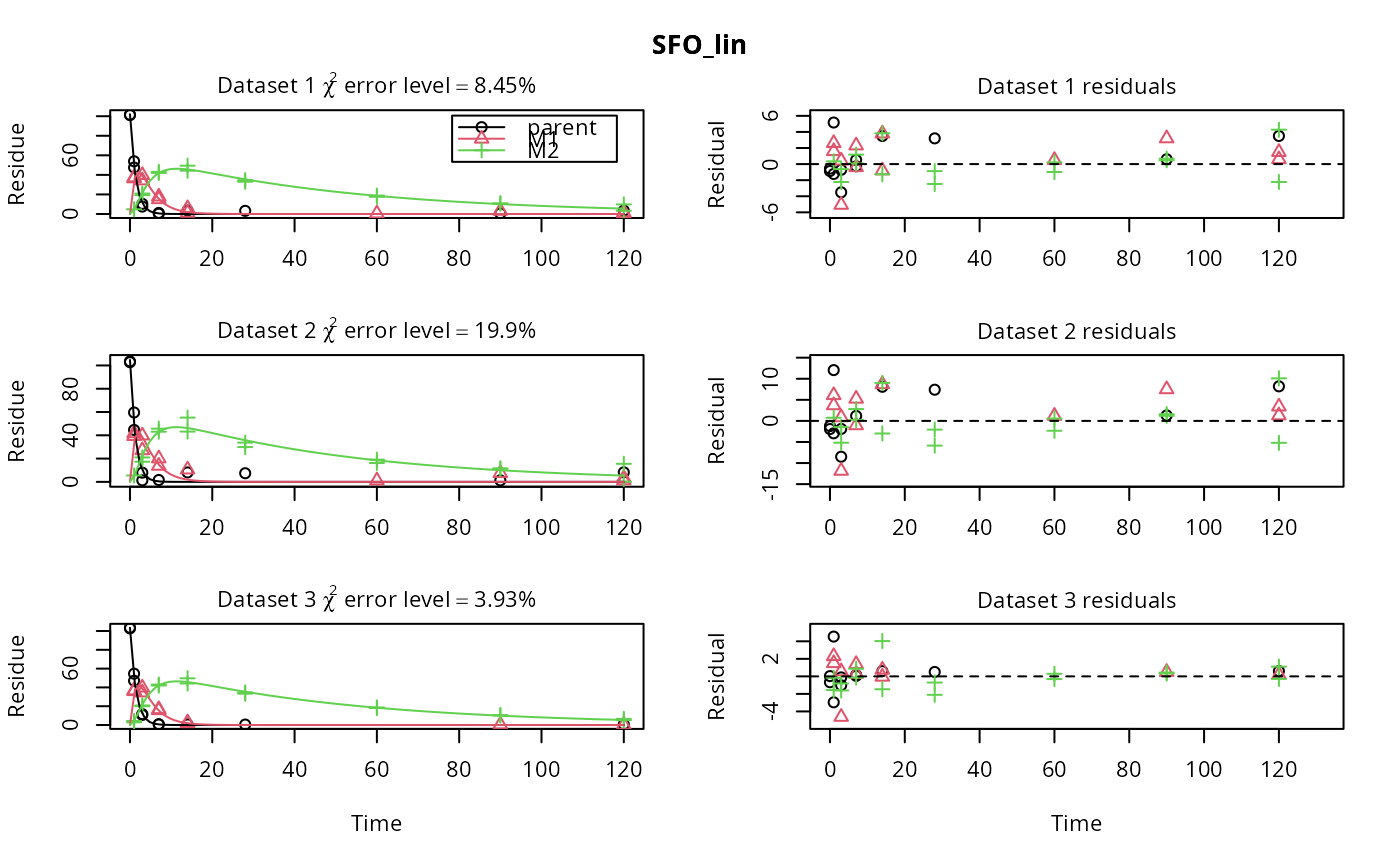
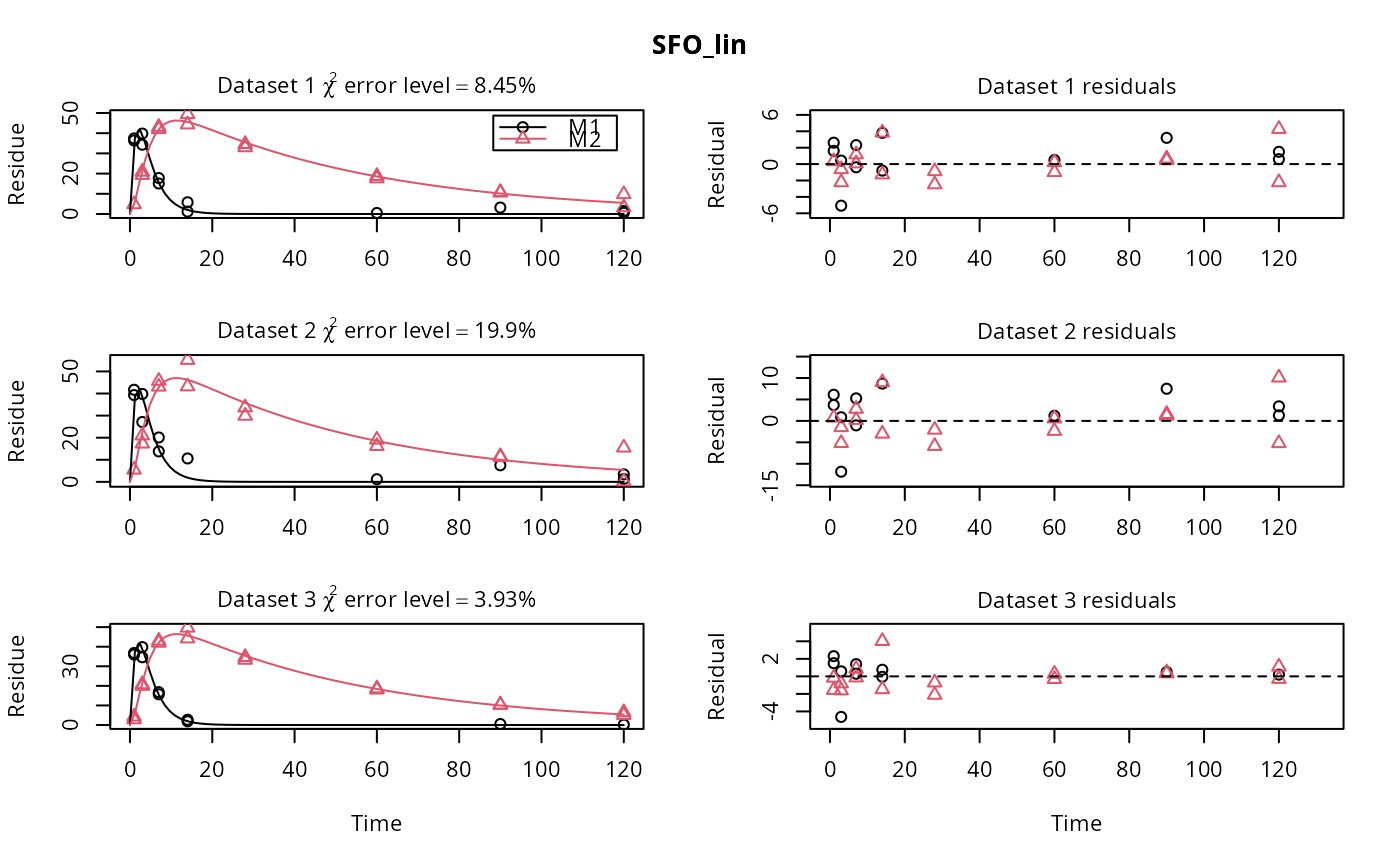
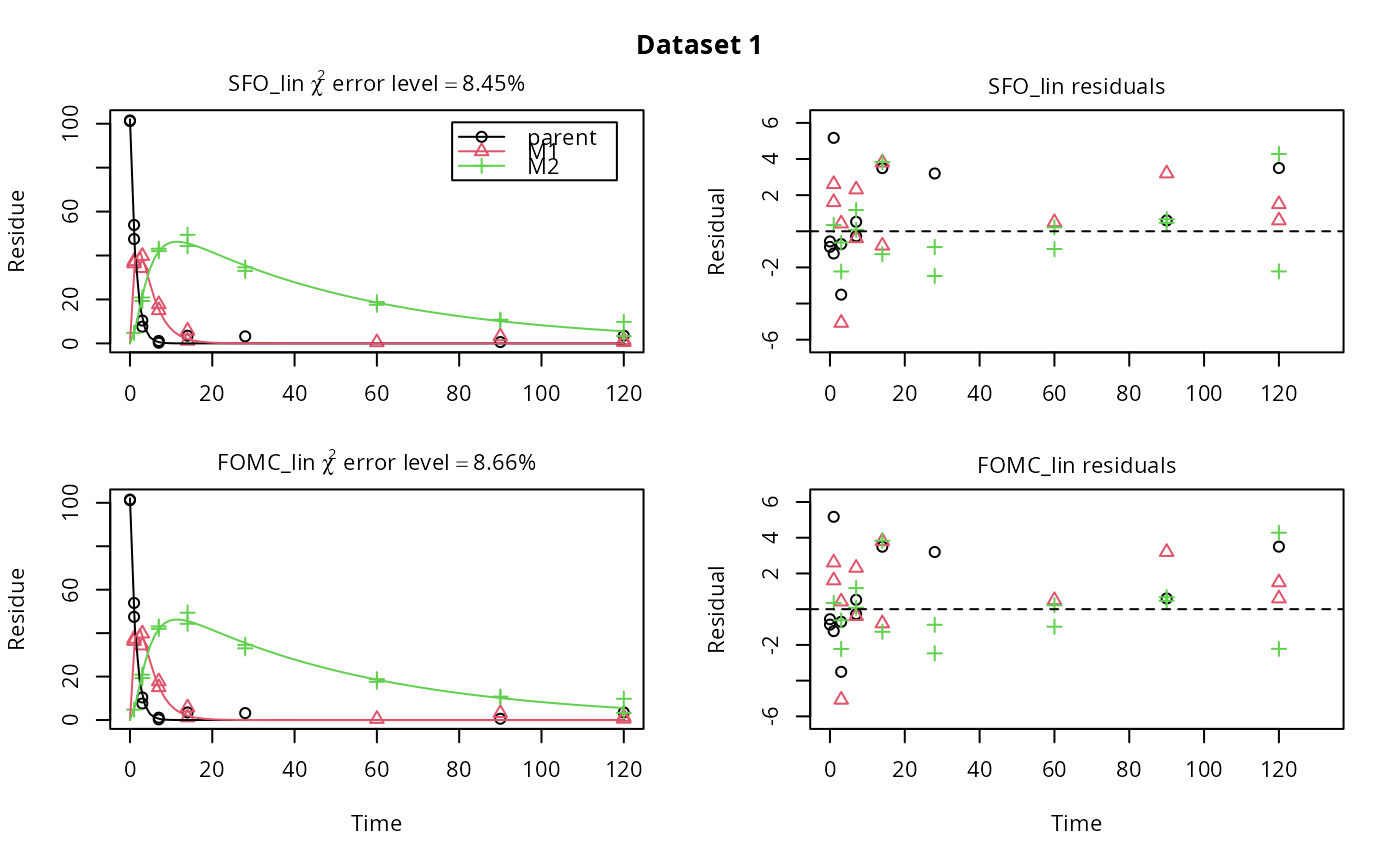
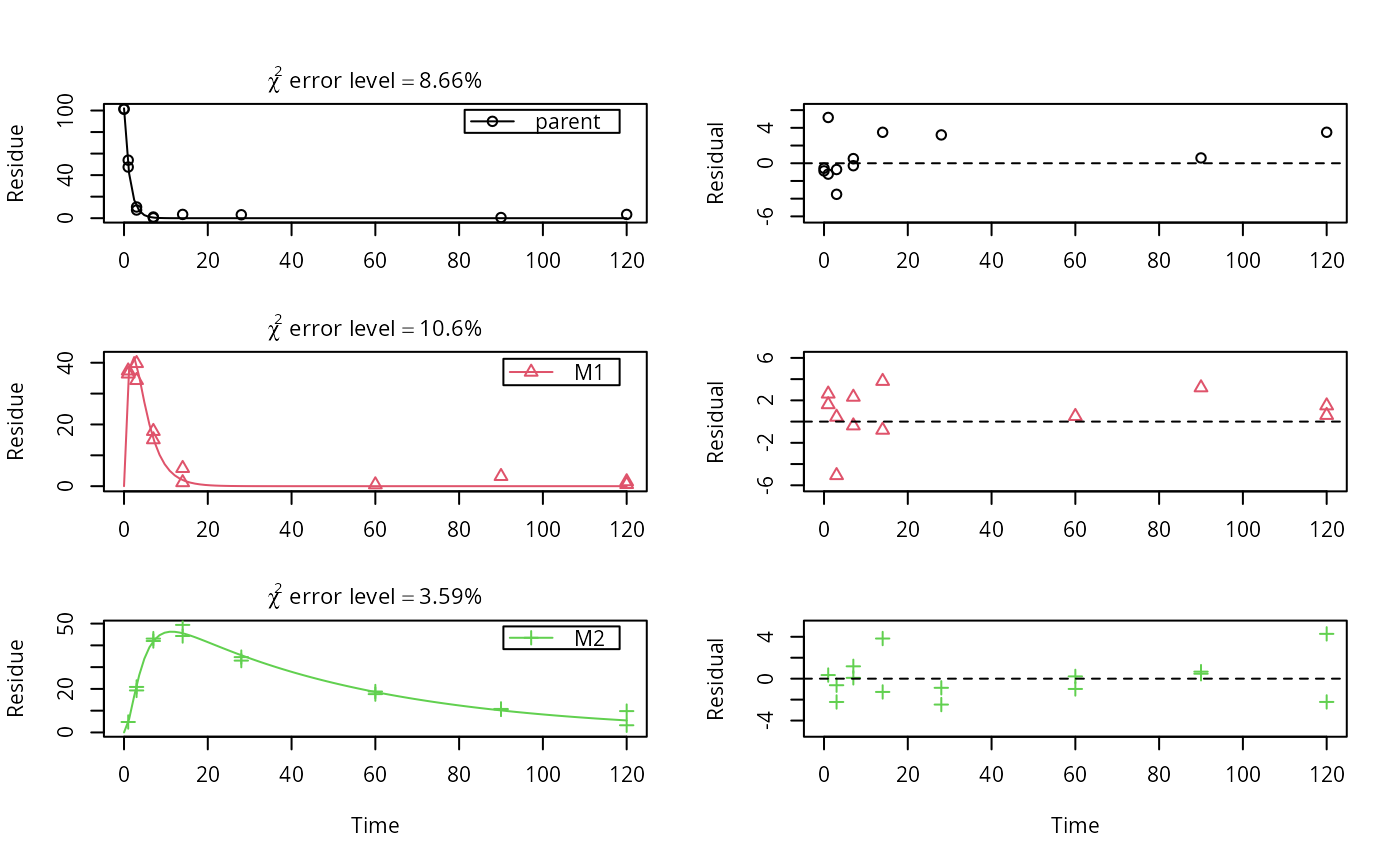
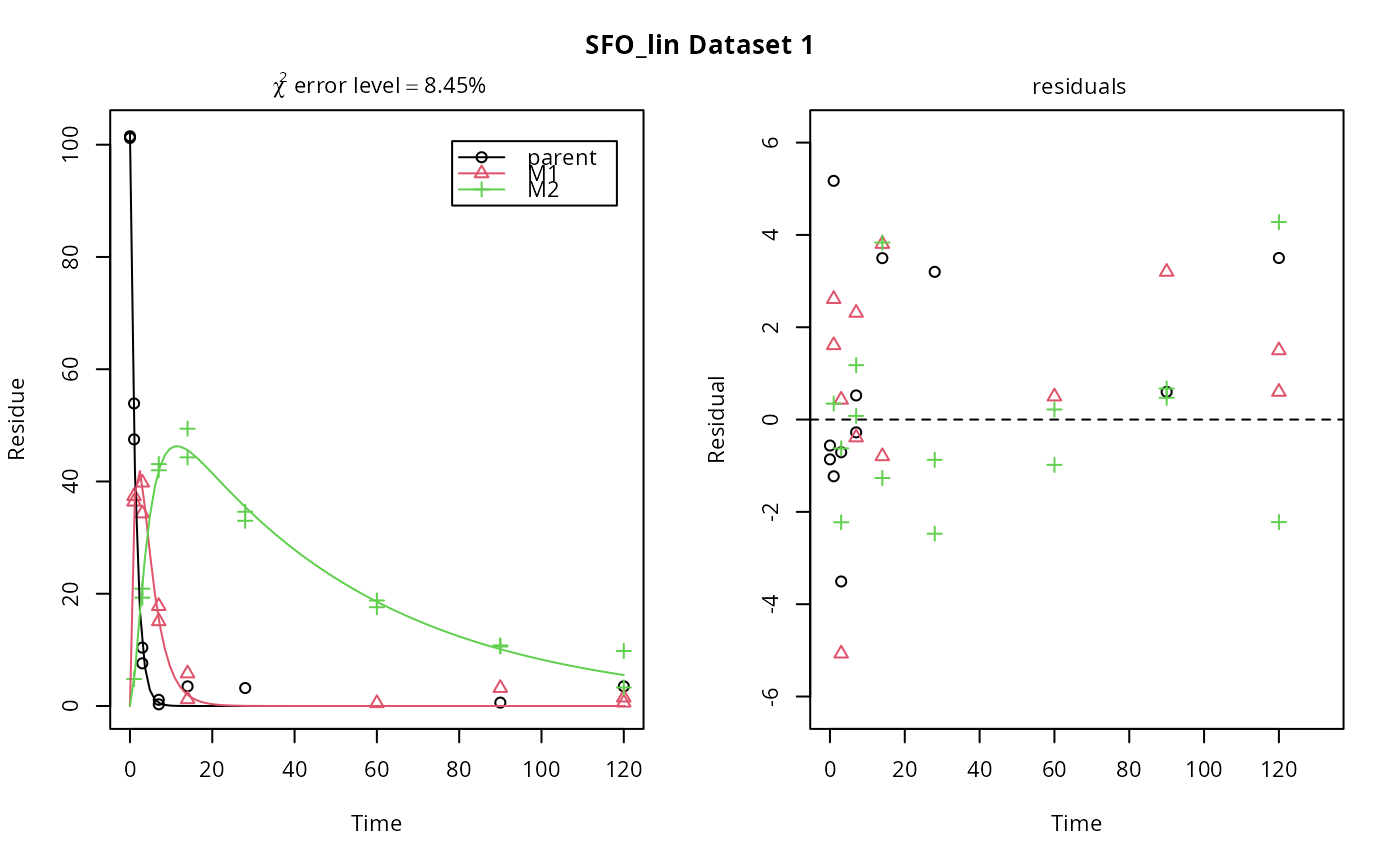
# \dontrun{ m_synth_SFO_lin <- mkinmod(parent = mkinsub("SFO", "M1"), M1 = mkinsub("SFO", "M2"), M2 = mkinsub("SFO"), use_of_ff = "max")#>m_synth_FOMC_lin <- mkinmod(parent = mkinsub("FOMC", "M1"), M1 = mkinsub("SFO", "M2"), M2 = mkinsub("SFO"), use_of_ff = "max")#>models <- list(SFO_lin = m_synth_SFO_lin, FOMC_lin = m_synth_FOMC_lin) datasets <- lapply(synthetic_data_for_UBA_2014[1:3], function(x) x$data) names(datasets) <- paste("Dataset", 1:3) time_default <- system.time(fits.0 <- mmkin(models, datasets, quiet = TRUE)) time_1 <- system.time(fits.4 <- mmkin(models, datasets, cores = 1, quiet = TRUE)) time_default#> user system elapsed #> 4.634 0.317 1.280time_1#> user system elapsed #> 5.249 0.016 5.267#> $ff #> parent_M1 parent_sink M1_M2 M1_sink #> 0.7340478 0.2659522 0.7505687 0.2494313 #> #> $distimes #> DT50 DT90 #> parent 0.877769 2.915885 #> M1 2.325746 7.725960 #> M2 33.720083 112.015691 #># Use double brackets to extract a single mkinfit object, which will be plotted # by plot.mkinfit and can be plotted using plot_sep plot(fits.0[[1, 1]], sep_obs = TRUE, show_residuals = TRUE, show_errmin = TRUE)plot_sep(fits.0[[1, 1]]) # Plotting with mmkin (single brackets, extracting an mmkin object) does not # allow to plot the observed variables separately plot(fits.0[1, 1])# On Windows, we can use multiple cores by making a cluster using the parallel # package, which gets loaded with mkin, and passing it to mmkin, e.g. cl <- makePSOCKcluster(12) f <- mmkin(c("SFO", "FOMC", "DFOP"), list(A = FOCUS_2006_A, B = FOCUS_2006_B, C = FOCUS_2006_C, D = FOCUS_2006_D), cluster = cl, quiet = TRUE) print(f)#> <mmkin> object #> Status of individual fits: #> #> dataset #> model A B C D #> SFO OK OK OK OK #> FOMC C OK OK OK #> DFOP OK OK OK OK #> #> OK: No warnings #> C: Optimisation did not converge: #> false convergence (8)# We get false convergence for the FOMC fit to FOCUS_2006_A because this # dataset is really SFO, and the FOMC fit is overparameterised stopCluster(cl) # }