Plot predictions from a fitted nonlinear mixed model obtained via an mmkin row object
Source:R/plot.mixed.mmkin.R
plot.mixed.mmkin.RdPlot predictions from a fitted nonlinear mixed model obtained via an mmkin row object
# S3 method for mixed.mmkin
plot(
  x,
  i = 1:ncol(x$mmkin),
  obs_vars = names(x$mkinmod$map),
  standardized = TRUE,
  xlab = "Time",
  xlim = range(x$data$time),
  resplot = c("predicted", "time"),
  pred_over = NULL,
  test_log_parms = FALSE,
  conf.level = 0.6,
  default_log_parms = NA,
  ymax = "auto",
  maxabs = "auto",
  ncol.legend = ifelse(length(i) <= 3, length(i) + 1, ifelse(length(i) <= 8, 3, 4)),
  nrow.legend = ceiling((length(i) + 1)/ncol.legend),
  rel.height.legend = 0.02 + 0.07 * nrow.legend,
  rel.height.bottom = 1.1,
  pch_ds = 1:length(i),
  col_ds = pch_ds + 1,
  lty_ds = col_ds,
  frame = TRUE,
  ...
)
Arguments
- x
An object of class mixed.mmkin, saem.mmkin or nlme.mmkin
- i
A numeric index to select datasets for which to plot the individual predictions, in case plots get too large
- obs_vars
A character vector of names of the observed variables for which the data and the model should be plotted. Defauls to all observed variables in the model.
- standardized
Should the residuals be standardized? Only takes effect if
resplot = "time".- xlab
Label for the x axis.
- xlim
Plot range in x direction.
- resplot
Should the residuals plotted against time or against predicted values?
- pred_over
Named list of alternative predictions as obtained from mkinpredict with a compatible mkinmod.
- test_log_parms
Passed to mean_degparms in the case of an mixed.mmkin object
- conf.level
Passed to mean_degparms in the case of an mixed.mmkin object
- default_log_parms
Passed to mean_degparms in the case of an mixed.mmkin object
- ymax
Vector of maximum y axis values
- maxabs
Maximum absolute value of the residuals. This is used for the scaling of the y axis and defaults to "auto".
- ncol.legend
Number of columns to use in the legend
- nrow.legend
Number of rows to use in the legend
- rel.height.legend
The relative height of the legend shown on top
- rel.height.bottom
The relative height of the bottom plot row
- pch_ds
Symbols to be used for plotting the data.
- col_ds
Colors used for plotting the observed data and the corresponding model prediction lines for the different datasets.
- lty_ds
Line types to be used for the model predictions.
- frame
Should a frame be drawn around the plots?
- ...
Further arguments passed to
plot.
Value
The function is called for its side effect.
Examples
ds <- lapply(experimental_data_for_UBA_2019[6:10],
function(x) x$data[c("name", "time", "value")])
names(ds) <- paste0("ds ", 6:10)
dfop_sfo <- mkinmod(parent = mkinsub("DFOP", "A1"),
A1 = mkinsub("SFO"), quiet = TRUE)
# \dontrun{
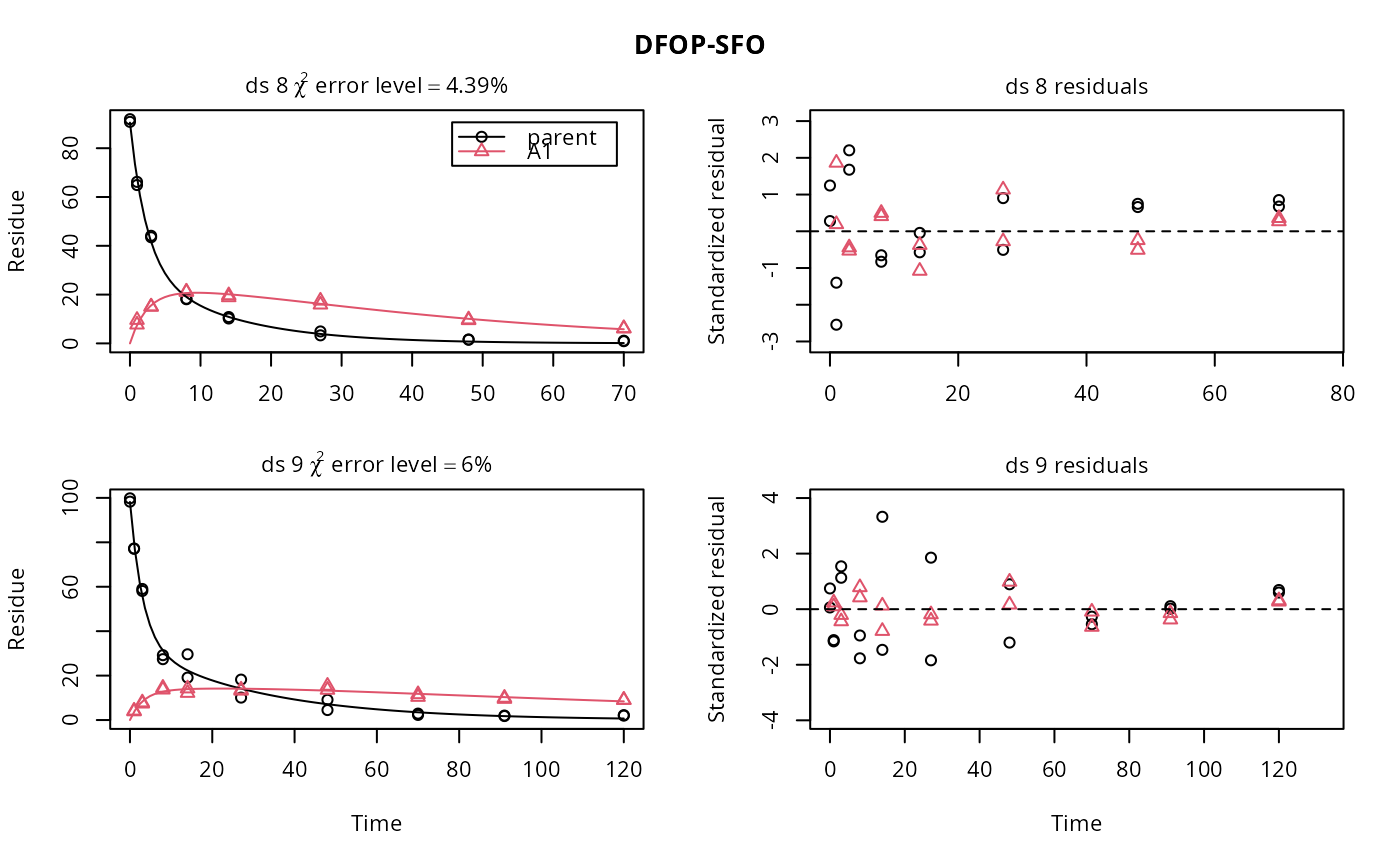
f <- mmkin(list("DFOP-SFO" = dfop_sfo), ds, quiet = TRUE)
plot(f[, 3:4], standardized = TRUE)
 # For this fit we need to increase pnlsMaxiter, and we increase the
# tolerance in order to speed up the fit for this example evaluation
# It still takes 20 seconds to run
f_nlme <- nlme(f, control = list(pnlsMaxIter = 120, tolerance = 1e-3))
plot(f_nlme)
# For this fit we need to increase pnlsMaxiter, and we increase the
# tolerance in order to speed up the fit for this example evaluation
# It still takes 20 seconds to run
f_nlme <- nlme(f, control = list(pnlsMaxIter = 120, tolerance = 1e-3))
plot(f_nlme)
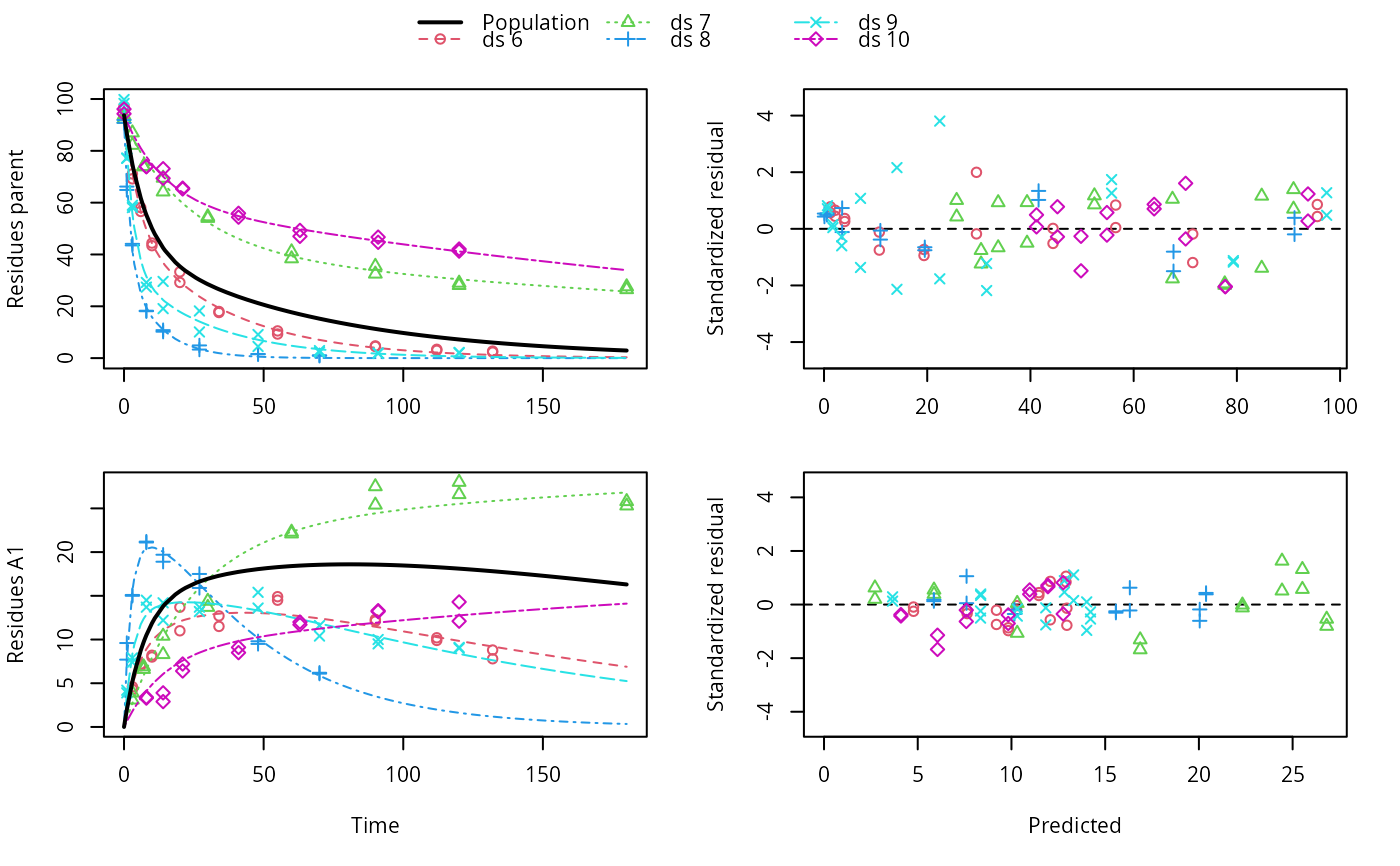
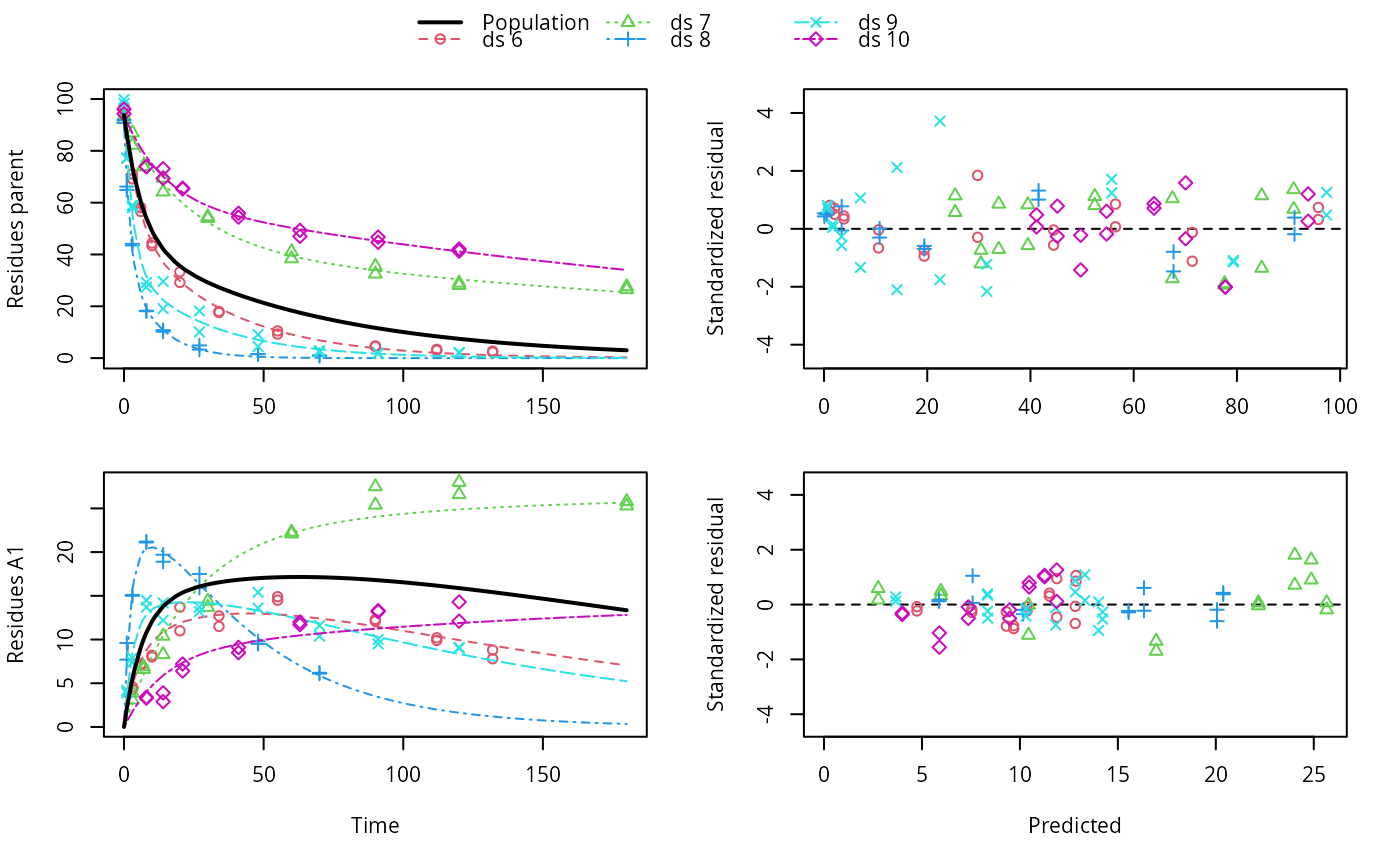 f_saem <- saem(f, transformations = "saemix")
plot(f_saem)
f_saem <- saem(f, transformations = "saemix")
plot(f_saem)
 f_obs <- mmkin(list("DFOP-SFO" = dfop_sfo), ds, quiet = TRUE, error_model = "obs")
f_nlmix <- nlmix(f_obs)
#> Error in nlmix(f_obs): could not find function "nlmix"
plot(f_nlmix)
#> Error in plot(f_nlmix): object 'f_nlmix' not found
# We can overlay the two variants if we generate predictions
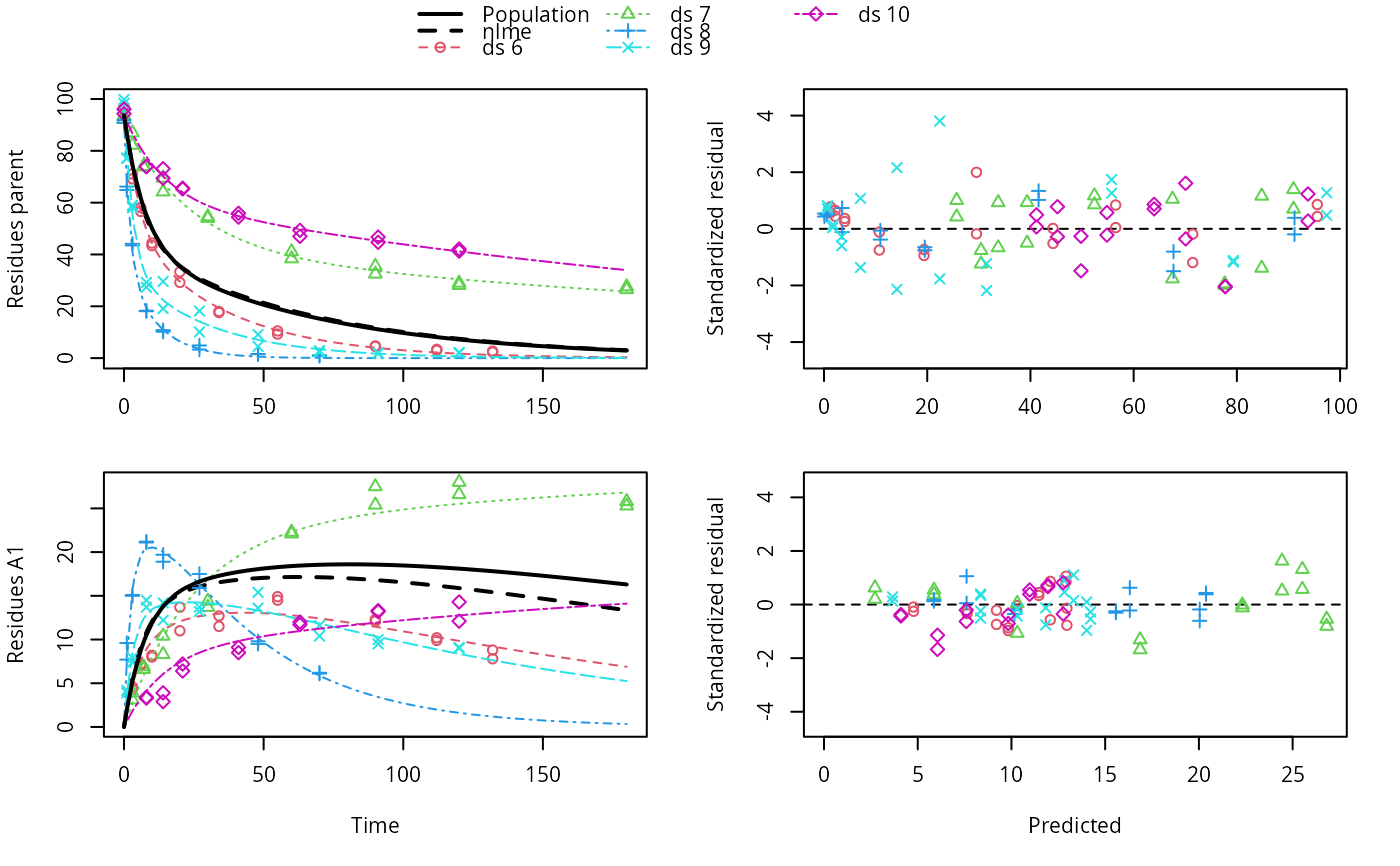
pred_nlme <- mkinpredict(dfop_sfo,
f_nlme$bparms.optim[-1],
c(parent = f_nlme$bparms.optim[[1]], A1 = 0),
seq(0, 180, by = 0.2))
plot(f_saem, pred_over = list(nlme = pred_nlme))
f_obs <- mmkin(list("DFOP-SFO" = dfop_sfo), ds, quiet = TRUE, error_model = "obs")
f_nlmix <- nlmix(f_obs)
#> Error in nlmix(f_obs): could not find function "nlmix"
plot(f_nlmix)
#> Error in plot(f_nlmix): object 'f_nlmix' not found
# We can overlay the two variants if we generate predictions
pred_nlme <- mkinpredict(dfop_sfo,
f_nlme$bparms.optim[-1],
c(parent = f_nlme$bparms.optim[[1]], A1 = 0),
seq(0, 180, by = 0.2))
plot(f_saem, pred_over = list(nlme = pred_nlme))
 # }
# }