<!-- Generated by pkgdown: do not edit by hand --> <!DOCTYPE html> <html lang="en"> <head> <meta charset="utf-8"> <meta http-equiv="X-UA-Compatible" content="IE=edge"> <meta name="viewport" content="width=device-width, initial-scale=1.0"> <title>Plot the observed data and the fitted model of an mkinfit object — plot.mkinfit • mkin</title> <!-- jquery --> <script src="https://cdnjs.cloudflare.com/ajax/libs/jquery/3.3.1/jquery.min.js" integrity="sha256-FgpCb/KJQlLNfOu91ta32o/NMZxltwRo8QtmkMRdAu8=" crossorigin="anonymous"></script> <!-- Bootstrap --> <link rel="stylesheet" href="https://cdnjs.cloudflare.com/ajax/libs/twitter-bootstrap/3.3.7/css/bootstrap.min.css" integrity="sha256-916EbMg70RQy9LHiGkXzG8hSg9EdNy97GazNG/aiY1w=" crossorigin="anonymous" /> <script src="https://cdnjs.cloudflare.com/ajax/libs/twitter-bootstrap/3.3.7/js/bootstrap.min.js" integrity="sha256-U5ZEeKfGNOja007MMD3YBI0A3OSZOQbeG6z2f2Y0hu8=" crossorigin="anonymous"></script> <!-- Font Awesome icons --> <link rel="stylesheet" href="https://cdnjs.cloudflare.com/ajax/libs/font-awesome/4.7.0/css/font-awesome.min.css" integrity="sha256-eZrrJcwDc/3uDhsdt61sL2oOBY362qM3lon1gyExkL0=" crossorigin="anonymous" /> <!-- clipboard.js --> <script src="https://cdnjs.cloudflare.com/ajax/libs/clipboard.js/2.0.4/clipboard.min.js" integrity="sha256-FiZwavyI2V6+EXO1U+xzLG3IKldpiTFf3153ea9zikQ=" crossorigin="anonymous"></script> <!-- sticky kit --> <script src="https://cdnjs.cloudflare.com/ajax/libs/sticky-kit/1.1.3/sticky-kit.min.js" integrity="sha256-c4Rlo1ZozqTPE2RLuvbusY3+SU1pQaJC0TjuhygMipw=" crossorigin="anonymous"></script> <!-- pkgdown --> <link href="../pkgdown.css" rel="stylesheet"> <script src="../pkgdown.js"></script> <meta property="og:title" content="Plot the observed data and the fitted model of an mkinfit object — plot.mkinfit" /> <meta property="og:description" content="Solves the differential equations with the optimised and fixed parameters from a previous successful call to mkinfit and plots the observed data together with the solution of the fitted model. If the current plot device is a tikz device, then latex is being used for the formatting of the chi2 error level, if show_errmin = TRUE." /> <meta name="twitter:card" content="summary" /> <!-- mathjax --> <script src="https://cdnjs.cloudflare.com/ajax/libs/mathjax/2.7.5/MathJax.js" integrity="sha256-nvJJv9wWKEm88qvoQl9ekL2J+k/RWIsaSScxxlsrv8k=" crossorigin="anonymous"></script> <script src="https://cdnjs.cloudflare.com/ajax/libs/mathjax/2.7.5/config/TeX-AMS-MML_HTMLorMML.js" integrity="sha256-84DKXVJXs0/F8OTMzX4UR909+jtl4G7SPypPavF+GfA=" crossorigin="anonymous"></script> <!--[if lt IE 9]> <script src="https://oss.maxcdn.com/html5shiv/3.7.3/html5shiv.min.js"></script> <script src="https://oss.maxcdn.com/respond/1.4.2/respond.min.js"></script> <![endif]--> </head> <body> <div class="container template-reference-topic"> <header> <div class="navbar navbar-default navbar-fixed-top" role="navigation"> <div class="container"> <div class="navbar-header"> <button type="button" class="navbar-toggle collapsed" data-toggle="collapse" data-target="#navbar" aria-expanded="false"> <span class="sr-only">Toggle navigation</span> <span class="icon-bar"></span> <span class="icon-bar"></span> <span class="icon-bar"></span> </button> <span class="navbar-brand"> <a class="navbar-link" href="../index.html">mkin</a> <span class="version label label-default" data-toggle="tooltip" data-placement="bottom" title="Released version">0.9.48.1</span> </span> </div> <div id="navbar" class="navbar-collapse collapse"> <ul class="nav navbar-nav"> <li> <a href="../reference/index.html">Functions and data</a> </li> <li class="dropdown"> <a href="#" class="dropdown-toggle" data-toggle="dropdown" role="button" aria-expanded="false"> Articles <span class="caret"></span> </a> <ul class="dropdown-menu" role="menu"> <li> <a href="../articles/mkin.html">Introduction to mkin</a> </li> <li> <a href="../articles/FOCUS_D.html">Example evaluation of FOCUS Example Dataset D</a> </li> <li> <a href="../articles/FOCUS_L.html">Example evaluation of FOCUS Laboratory Data L1 to L3</a> </li> <li> <a href="../articles/web_only/FOCUS_Z.html">Example evaluation of FOCUS Example Dataset Z</a> </li> <li> <a href="../articles/web_only/compiled_models.html">Performance benefit by using compiled model definitions in mkin</a> </li> <li> <a href="../articles/twa.html">Calculation of time weighted average concentrations with mkin</a> </li> <li> <a href="../articles/web_only/NAFTA_examples.html">Example evaluation of NAFTA SOP Attachment examples</a> </li> </ul> </li> <li> <a href="../news/index.html">News</a> </li> </ul> <ul class="nav navbar-nav navbar-right"> </ul> </div><!--/.nav-collapse --> </div><!--/.container --> </div><!--/.navbar --> </header> <div class="row"> <div class="col-md-9 contents"> <div class="page-header"> <h1>Plot the observed data and the fitted model of an mkinfit object</h1> <div class="hidden name"><code>plot.mkinfit.Rd</code></div> </div> <div class="ref-description"> <p>Solves the differential equations with the optimised and fixed parameters from a previous successful call to <code><a href='mkinfit.html'>mkinfit</a></code> and plots the observed data together with the solution of the fitted model.</p> <p>If the current plot device is a <code><a href='https://www.rdocumentation.org/packages/tikzDevice/topics/tikz'>tikz</a></code> device, then latex is being used for the formatting of the chi2 error level, if <code>show_errmin = TRUE</code>.</p> </div> <pre class="usage"># S3 method for mkinfit plot(x, fit = x, obs_vars = names(fit$mkinmod$map), xlab = "Time", ylab = "Observed", xlim = range(fit$data$time), ylim = "default", col_obs = 1:length(obs_vars), pch_obs = col_obs, lty_obs = rep(1, length(obs_vars)), add = FALSE, legend = !add, show_residuals = FALSE, maxabs = "auto", sep_obs = FALSE, rel.height.middle = 0.9, lpos = "topright", inset = c(0.05, 0.05), show_errmin = FALSE, errmin_digits = 3, …) plot_sep(fit, sep_obs = TRUE, show_residuals = TRUE, show_errmin = TRUE, …)</pre> <h2 class="hasAnchor" id="arguments"><a class="anchor" href="#arguments"></a>Arguments</h2> <table class="ref-arguments"> <colgroup><col class="name" /><col class="desc" /></colgroup> <tr> <th>x</th> <td><p>Alias for fit introduced for compatibility with the generic S3 method.</p></td> </tr> <tr> <th>fit</th> <td><p>An object of class <code><a href='mkinfit.html'>mkinfit</a></code>.</p></td> </tr> <tr> <th>obs_vars</th> <td><p>A character vector of names of the observed variables for which the data and the model should be plotted. Defauls to all observed variables in the model.</p></td> </tr> <tr> <th>xlab</th> <td><p>Label for the x axis.</p></td> </tr> <tr> <th>ylab</th> <td><p>Label for the y axis.</p></td> </tr> <tr> <th>xlim</th> <td><p>Plot range in x direction.</p></td> </tr> <tr> <th>ylim</th> <td><p>Plot range in y direction.</p></td> </tr> <tr> <th>col_obs</th> <td><p>Colors used for plotting the observed data and the corresponding model prediction lines.</p></td> </tr> <tr> <th>pch_obs</th> <td><p>Symbols to be used for plotting the data.</p></td> </tr> <tr> <th>lty_obs</th> <td><p>Line types to be used for the model predictions.</p></td> </tr> <tr> <th>add</th> <td><p>Should the plot be added to an existing plot?</p></td> </tr> <tr> <th>legend</th> <td><p>Should a legend be added to the plot?</p></td> </tr> <tr> <th>show_residuals</th> <td><p>Should residuals be shown? If only one plot of the fits is shown, the residual plot is in the lower third of the plot? Otherwise, i.e. if "sep_obs" is given, the residual plots will be located to the right of the plots of the fitted curves.</p></td> </tr> <tr> <th>maxabs</th> <td><p>Maximum absolute value of the residuals. This is used for the scaling of the y axis and defaults to "auto".</p></td> </tr> <tr> <th>sep_obs</th> <td><p>Should the observed variables be shown in separate subplots? If yes, residual plots requested by "show_residuals" will be shown next to, not below the plot of the fits.</p></td> </tr> <tr> <th>rel.height.middle</th> <td><p>The relative height of the middle plot, if more than two rows of plots are shown.</p></td> </tr> <tr> <th>lpos</th> <td><p>Position(s) of the legend(s). Passed to <code><a href='https://www.rdocumentation.org/packages/graphics/topics/legend'>legend</a></code> as the first argument. If not length one, this should be of the same length as the obs_var argument.</p></td> </tr> <tr> <th>inset</th> <td><p>Passed to <code><a href='https://www.rdocumentation.org/packages/graphics/topics/legend'>legend</a></code> if applicable.</p></td> </tr> <tr> <th>show_errmin</th> <td><p>Should the FOCUS chi2 error value be shown in the upper margin of the plot?</p></td> </tr> <tr> <th>errmin_digits</th> <td><p>The number of significant digits for rounding the FOCUS chi2 error percentage.</p></td> </tr> <tr> <th>…</th> <td><p>Further arguments passed to <code><a href='https://www.rdocumentation.org/packages/graphics/topics/plot'>plot</a></code>.</p></td> </tr> </table> <h2 class="hasAnchor" id="value"><a class="anchor" href="#value"></a>Value</h2> <p>The function is called for its side effect.</p> <h2 class="hasAnchor" id="examples"><a class="anchor" href="#examples"></a>Examples</h2> <pre class="examples"><div class='input'><span class='co'># 
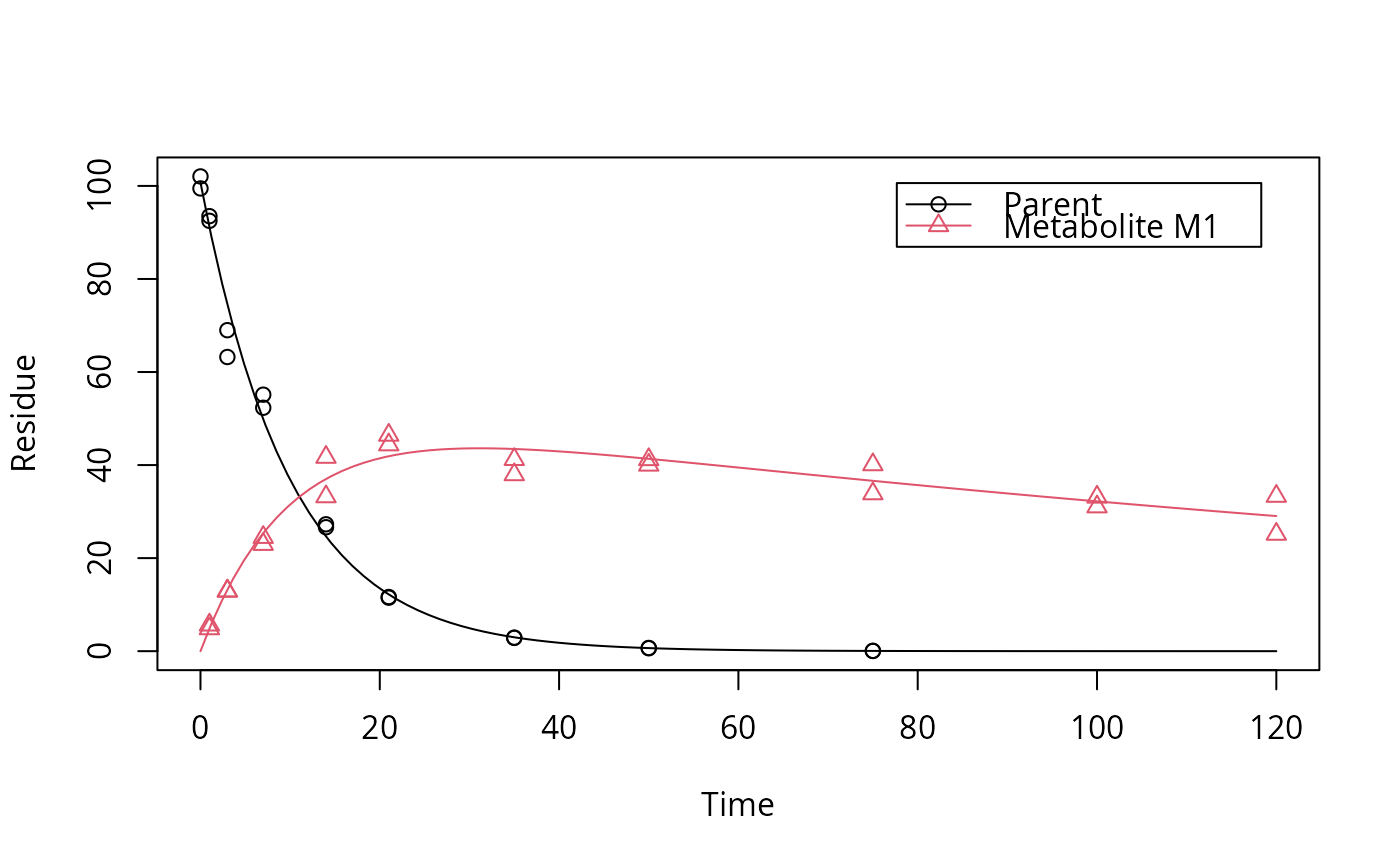
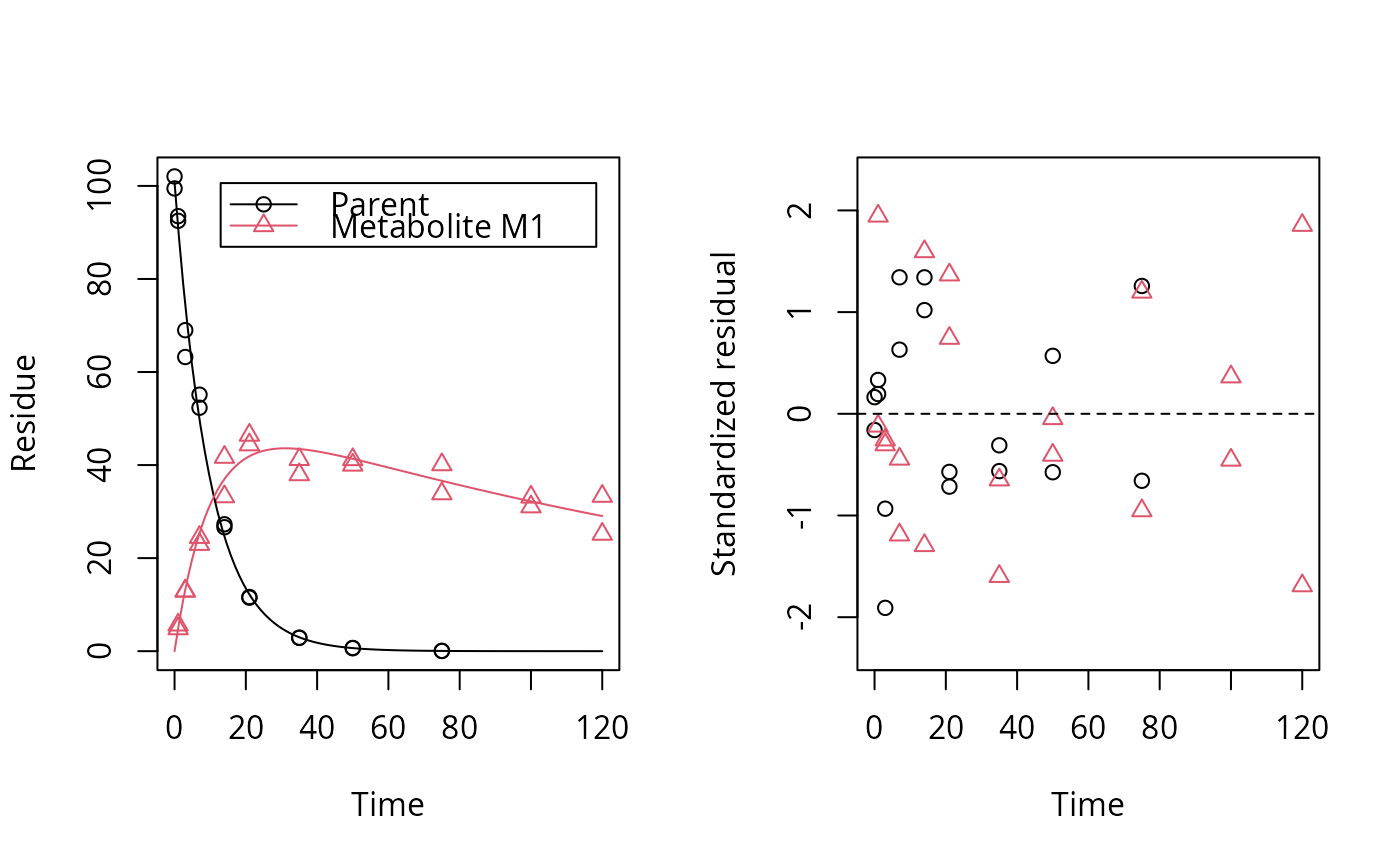
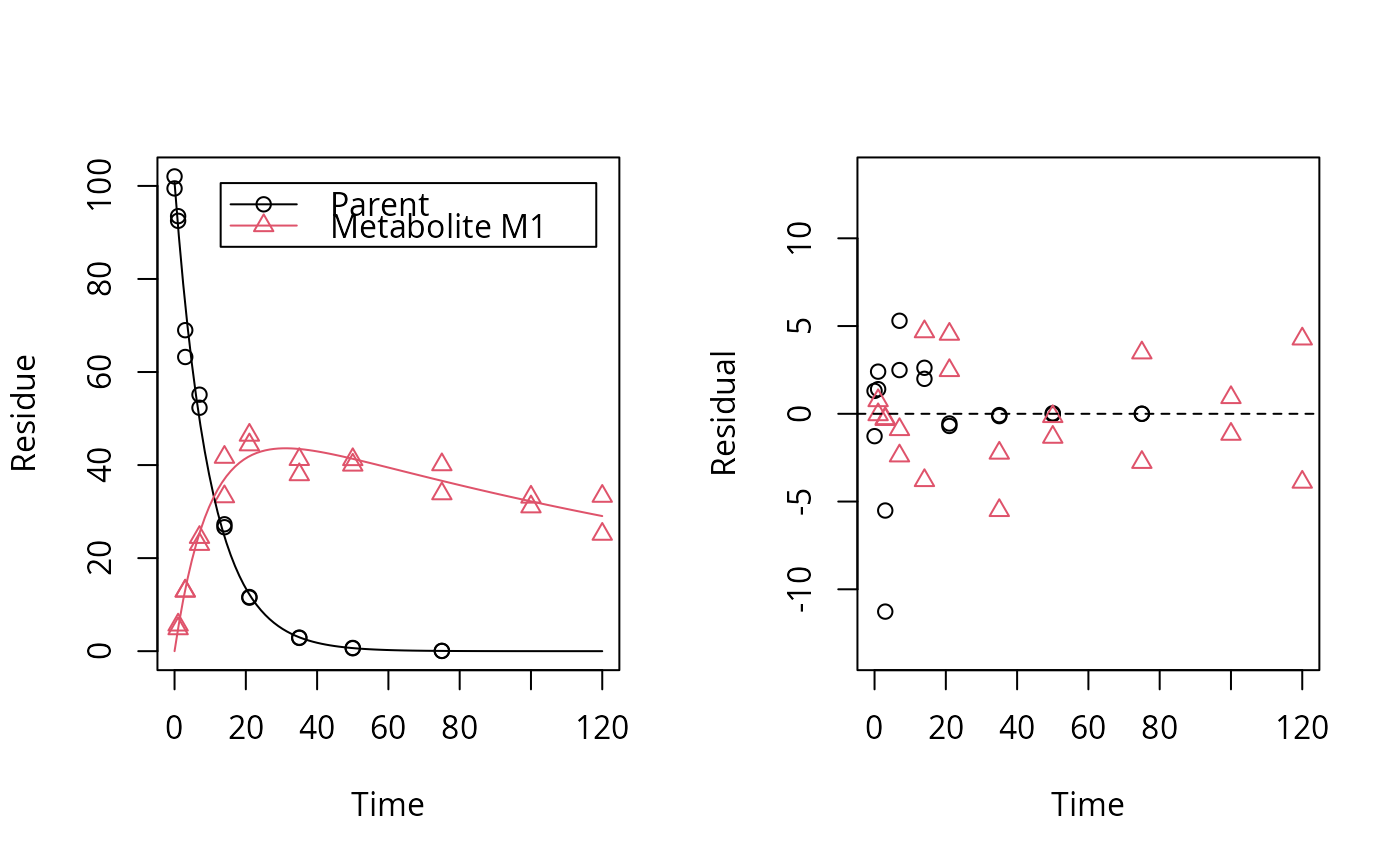
One parent compound, one metabolite, both single first order, path from</span> <span class='co'># parent to sink included, use Levenberg-Marquardt for speed</span> <span class='no'>SFO_SFO</span> <span class='kw'><-</span> <span class='fu'><a href='mkinmod.html'>mkinmod</a></span>(<span class='kw'>parent</span> <span class='kw'>=</span> <span class='fu'><a href='mkinsub.html'>mkinsub</a></span>(<span class='st'>"SFO"</span>, <span class='st'>"m1"</span>, <span class='kw'>full</span> <span class='kw'>=</span> <span class='st'>"Parent"</span>), <span class='kw'>m1</span> <span class='kw'>=</span> <span class='fu'><a href='mkinsub.html'>mkinsub</a></span>(<span class='st'>"SFO"</span>, <span class='kw'>full</span> <span class='kw'>=</span> <span class='st'>"Metabolite M1"</span> ))</div><div class='output co'>#> <span class='message'>Successfully compiled differential equation model from auto-generated C code.</span></div><div class='input'><span class='no'>fit</span> <span class='kw'><-</span> <span class='fu'><a href='mkinfit.html'>mkinfit</a></span>(<span class='no'>SFO_SFO</span>, <span class='no'>FOCUS_2006_D</span>, <span class='kw'>quiet</span> <span class='kw'>=</span> <span class='fl'>TRUE</span>, <span class='kw'>method.modFit</span> <span class='kw'>=</span> <span class='st'>"Marq"</span>) <span class='fu'><a href='https://www.rdocumentation.org/packages/graphics/topics/plot'>plot</a></span>(<span class='no'>fit</span>)</div><div class='img'><img src='plot.mkinfit-1.png' alt='' width='700' height='433' /></div><div class='input'><span class='fu'><a href='https://www.rdocumentation.org/packages/graphics/topics/plot'>plot</a></span>(<span class='no'>fit</span>, <span class='kw'>show_residuals</span> <span class='kw'>=</span> <span class='fl'>TRUE</span>)</div><div class='img'><img src='plot.mkinfit-2.png' alt='' width='700' height='433' /></div><div class='input'> <span class='co'># Show the observed variables separately</span> <span class='fu'><a href='https://www.rdocumentation.org/packages/graphics/topics/plot'>plot</a></span>(<span class='no'>fit</span>, <span class='kw'>sep_obs</span> <span class='kw'>=</span> <span class='fl'>TRUE</span>, <span class='kw'>lpos</span> <span class='kw'>=</span> <span class='fu'><a href='https://www.rdocumentation.org/packages/base/topics/c'>c</a></span>(<span class='st'>"topright"</span>, <span class='st'>"bottomright"</span>))</div><div class='img'><img src='plot.mkinfit-3.png' alt='' width='700' height='433' /></div><div class='input'> <span class='co'># Show the observed variables separately, with residuals</span> <span class='fu'><a href='https://www.rdocumentation.org/packages/graphics/topics/plot'>plot</a></span>(<span class='no'>fit</span>, <span class='kw'>sep_obs</span> <span class='kw'>=</span> <span class='fl'>TRUE</span>, <span class='kw'>show_residuals</span> <span class='kw'>=</span> <span class='fl'>TRUE</span>, <span class='kw'>lpos</span> <span class='kw'>=</span> <span class='fu'><a href='https://www.rdocumentation.org/packages/base/topics/c'>c</a></span>(<span class='st'>"topright"</span>, <span class='st'>"bottomright"</span>), <span class='kw'>show_errmin</span> <span class='kw'>=</span> <span class='fl'>TRUE</span>)</div><div class='img'><img src='plot.mkinfit-4.png' alt='' width='700' height='433' /></div><div class='input'> <span class='co'># The same can be obtained with less typing, using the convenience function plot_sep</span> <span class='fu'>plot_sep</span>(<span class='no'>fit</span>, <span class='kw'>lpos</span> <span class='kw'>=</span> <span class='fu'><a href='https://www.rdocumentation.org/packages/base/topics/c'>c</a></span>(<span class='st'>"topright"</span>, <span class='st'>"bottomright"</span>))</div></pre> </div> <div class="col-md-3 hidden-xs hidden-sm" id="sidebar"> <h2>Contents</h2> <ul class="nav nav-pills nav-stacked"> <li><a href="#arguments">Arguments</a></li> <li><a href="#value">Value</a></li> <li><a href="#examples">Examples</a></li> </ul> <h2>Author</h2> <p>Johannes Ranke</p> </div> </div> <footer> <div class="copyright"> <p>Developed by Johannes Ranke.</p> </div> <div class="pkgdown"> <p>Site built with <a href="https://pkgdown.r-lib.org/">pkgdown</a> 1.3.0.9000.</p> </div> </footer> </div> </body> </html>