Metabolism data set used for checking the software quality of KinGUI
schaefer07_complex_case.RdThis dataset was used for a comparison of KinGUI and ModelMaker to check the software quality of KinGUI in the original publication (Schäfer et al., 2007). The results from the fitting are also included.
Format
The data set is a data frame with 8 observations on the following 6 variables.
timea numeric vector
parenta numeric vector
A1a numeric vector
B1a numeric vector
C1a numeric vector
A2a numeric vector
The results are a data frame with 14 results for different parameter values
References
Schäfer D, Mikolasch B, Rainbird P and Harvey B (2007). KinGUI: a new kinetic software tool for evaluations according to FOCUS degradation kinetics. In: Del Re AAM, Capri E, Fragoulis G and Trevisan M (Eds.). Proceedings of the XIII Symposium Pesticide Chemistry, Piacenza, 2007, p. 916-923.
Examples
data <- mkin_wide_to_long(schaefer07_complex_case, time = "time")
model <- mkinmod(
parent = list(type = "SFO", to = c("A1", "B1", "C1"), sink = FALSE),
A1 = list(type = "SFO", to = "A2"),
B1 = list(type = "SFO"),
C1 = list(type = "SFO"),
A2 = list(type = "SFO"), use_of_ff = "max")
#> Temporary DLL for differentials generated and loaded
# \dontrun{
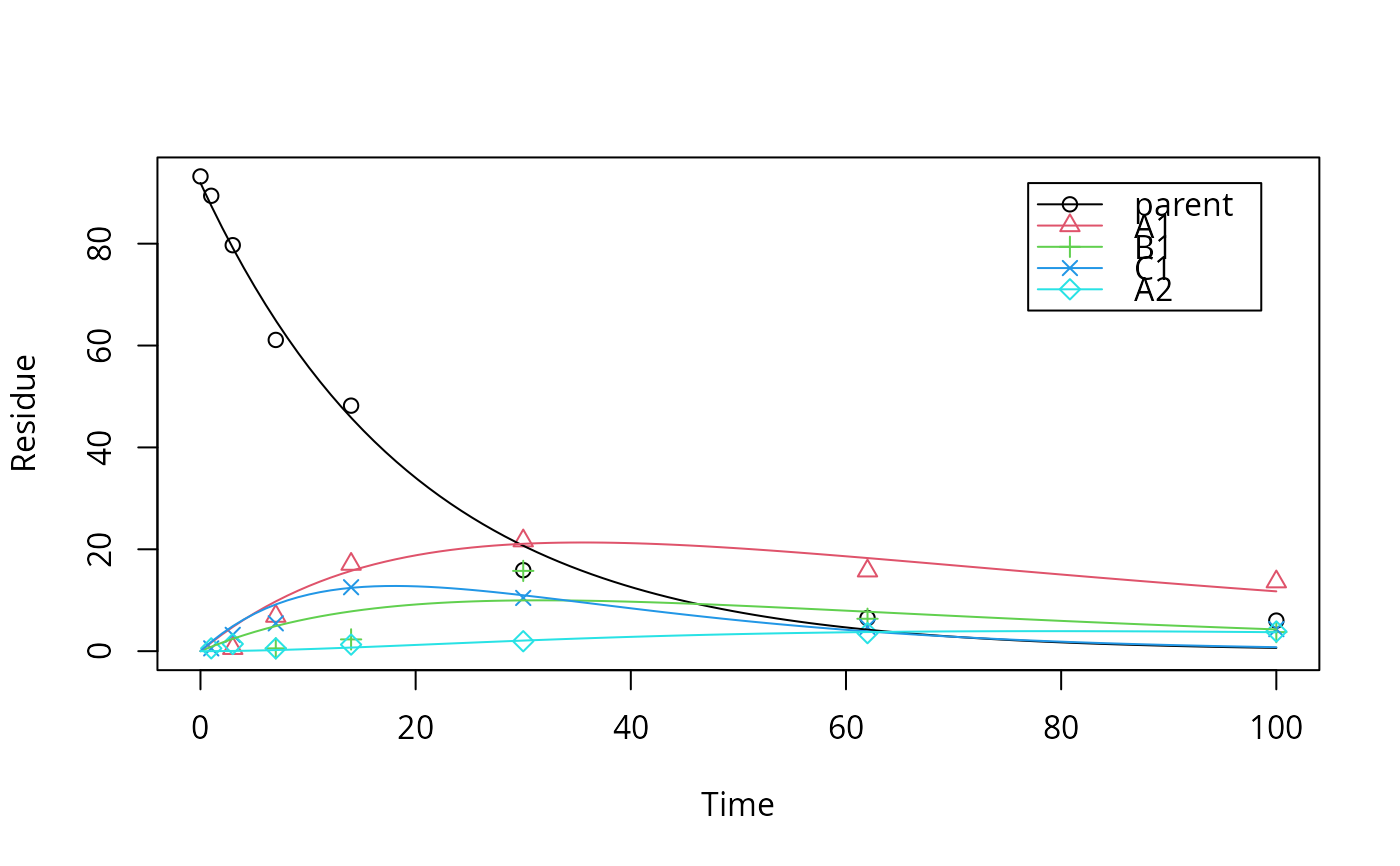
fit <- mkinfit(model, data, quiet = TRUE)
plot(fit)
 endpoints(fit)
#> $ff
#> parent_A1 parent_B1 parent_C1 parent_sink A1_A2 A1_sink
#> 0.3809618 0.1954668 0.4235714 0.0000000 0.4479540 0.5520460
#>
#> $distimes
#> DT50 DT90
#> parent 13.95078 46.34349
#> A1 49.75347 165.27745
#> B1 37.26905 123.80511
#> C1 11.23129 37.30955
#> A2 28.50690 94.69789
#>
# }
# Compare with the results obtained in the original publication
print(schaefer07_complex_results)
#> compound parameter KinGUI ModelMaker deviation
#> 1 parent degradation rate 0.0496 0.0506 2.0
#> 2 parent DT50 13.9900 13.6900 2.2
#> 3 metabolite A1 formation fraction 0.3803 0.3696 2.9
#> 4 metabolite A1 degradation rate 0.0139 0.0136 2.2
#> 5 metabolite A1 DT50 49.9600 50.8900 1.8
#> 6 metabolite B1 formation fraction 0.1866 0.1818 2.6
#> 7 metabolite B1 degradation rate 0.0175 0.0172 1.7
#> 8 metabolite B1 DT50 39.6100 40.2400 1.6
#> 9 metabolite C1 formation fraction 0.4331 0.4486 3.5
#> 10 metabolite C1 degradation rate 0.0638 0.0700 8.9
#> 11 metabolite C1 DT50 10.8700 9.9000 9.8
#> 12 metabolite A2 formation fraction 0.4529 0.4559 0.7
#> 13 metabolite A2 degradation rate 0.0245 0.0244 0.4
#> 14 metabolite A2 DT50 28.2400 28.4500 0.7
endpoints(fit)
#> $ff
#> parent_A1 parent_B1 parent_C1 parent_sink A1_A2 A1_sink
#> 0.3809618 0.1954668 0.4235714 0.0000000 0.4479540 0.5520460
#>
#> $distimes
#> DT50 DT90
#> parent 13.95078 46.34349
#> A1 49.75347 165.27745
#> B1 37.26905 123.80511
#> C1 11.23129 37.30955
#> A2 28.50690 94.69789
#>
# }
# Compare with the results obtained in the original publication
print(schaefer07_complex_results)
#> compound parameter KinGUI ModelMaker deviation
#> 1 parent degradation rate 0.0496 0.0506 2.0
#> 2 parent DT50 13.9900 13.6900 2.2
#> 3 metabolite A1 formation fraction 0.3803 0.3696 2.9
#> 4 metabolite A1 degradation rate 0.0139 0.0136 2.2
#> 5 metabolite A1 DT50 49.9600 50.8900 1.8
#> 6 metabolite B1 formation fraction 0.1866 0.1818 2.6
#> 7 metabolite B1 degradation rate 0.0175 0.0172 1.7
#> 8 metabolite B1 DT50 39.6100 40.2400 1.6
#> 9 metabolite C1 formation fraction 0.4331 0.4486 3.5
#> 10 metabolite C1 degradation rate 0.0638 0.0700 8.9
#> 11 metabolite C1 DT50 10.8700 9.9000 9.8
#> 12 metabolite A2 formation fraction 0.4529 0.4559 0.7
#> 13 metabolite A2 degradation rate 0.0245 0.0244 0.4
#> 14 metabolite A2 DT50 28.2400 28.4500 0.7